The year your address started to matter
Everyone knows American home insurance is falling apart, and everyone knows where. That part of the story turns out to be a distraction. The real change is that a market which spent decades not looking at where you live started looking, and you can date the week it happened.
In December 2024 the US Senate Budget Committee did something no regulator had managed: it asked 41 home insurers for their non-renewal counts, county by county, and published what came back. Twenty-three of them answered. Together they cover about 65% of the American homeowners market, and the file runs to 249 million policy-years across 2018–2023.
The committee read it as a climate story, which it is. But a county-level file with six years of history can answer a question the report didn't ask: how much does a county's actual, measured disaster risk have to do with whether its insurers walk away?
The answer, for 2018, is almost nothing.
Two federal files that had never been introduced
FEMA publishes a National Risk Index. For every county in America it models the expected annual loss to buildings from eighteen hazards — wildfire, hurricane, inland flood, tornado, the lot — in dollars per year. Divide that by the county's total building value and you get something an insurer would recognise immediately: a pure loss cost, the expected annual damage per dollar of property. I express it per $10,000 of building value.
That number is the closest thing to an objective answer to “how dangerous is it here?” And critically, it holds still. It is a fixed property of a county, computed once, sitting in the same file for the whole window.
So: join it to the Senate file. Keep counties with at least 5,000 policies in every one of the six years, so the rates are stable — that leaves 1,114 counties and 38 million policies in 2023. Then, for each year separately, correlate the risk score against the non-renewal rate.
2018–2023
stable rate
in the file
of the market
0.02, and then 0.48
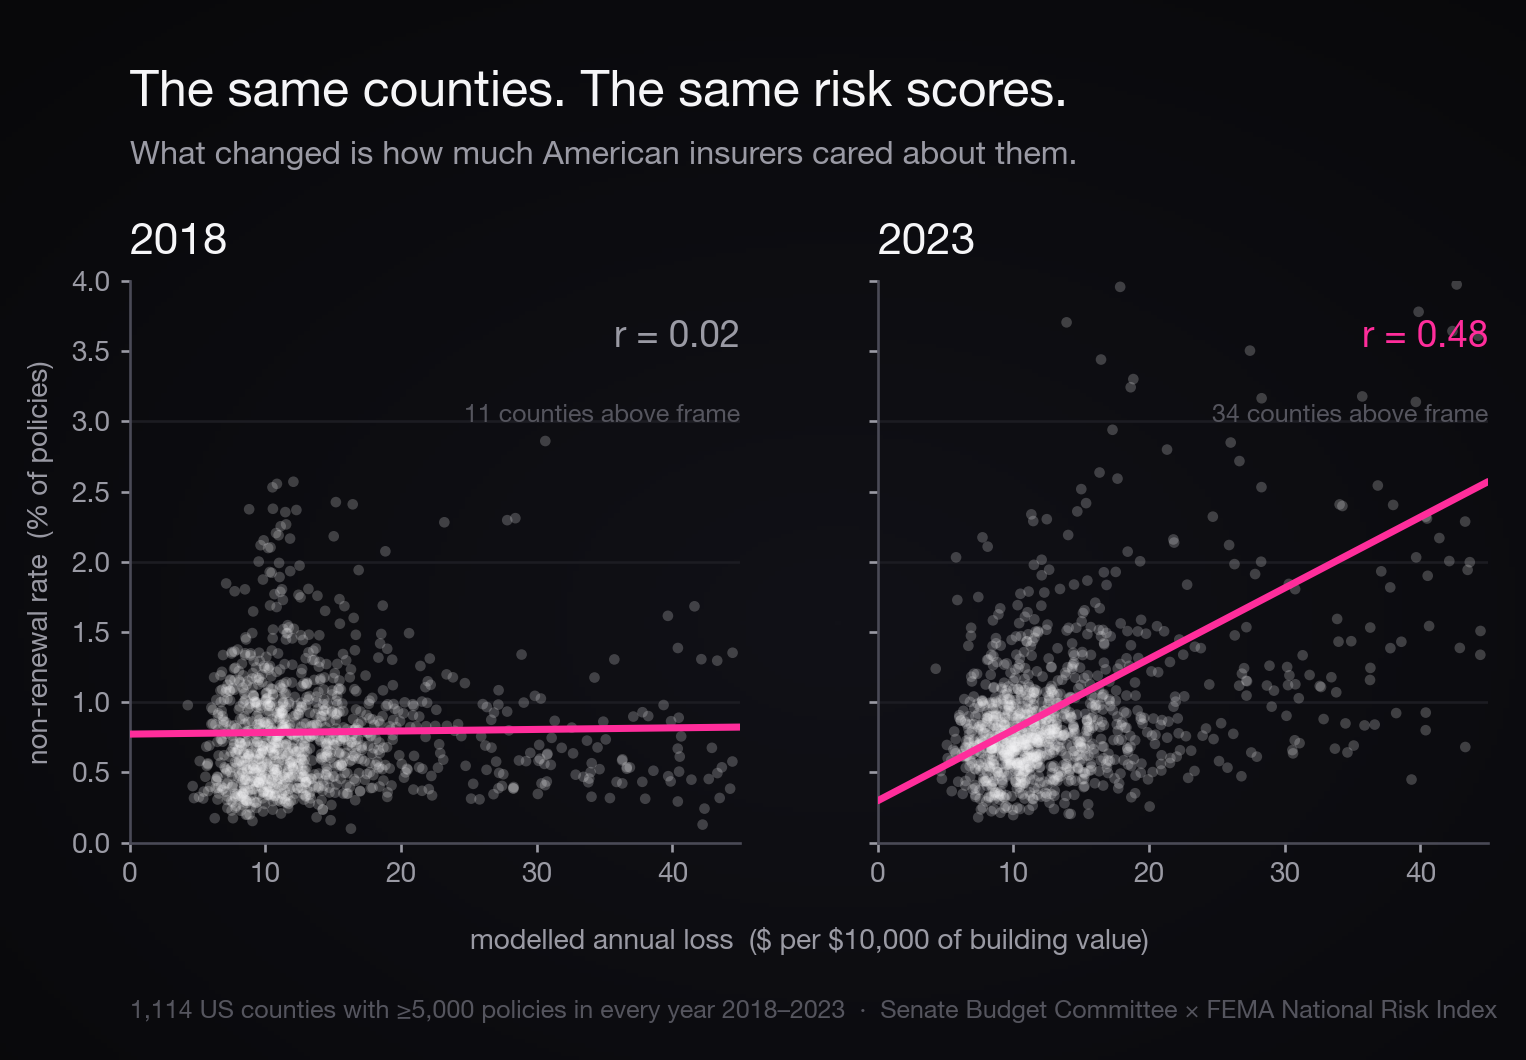
In 2018 the correlation between a county's modelled disaster risk and its home-insurance non-renewal rate was r = 0.02. Squared, that is 0.04% — four hundredths of one percent of the variation. Insurers were dropping people in the safest tenth of America at essentially the same rate as in the most dangerous tenth.
Run the identical calculation on the identical counties with the identical risk scores for 2023 and you get r = 0.48.
Sorted into ten equal groups by risk, the 2018 ladder is almost flat: the safest decile non-renewed 0.68% of policies, the riskiest 0.83%. A gap of 0.15 percentage points across the entire range of American natural hazard. By 2023 the safest decile is at 0.76% and the riskiest at 1.82%, a gap of 1.06 points. The spread widened 7.3×.
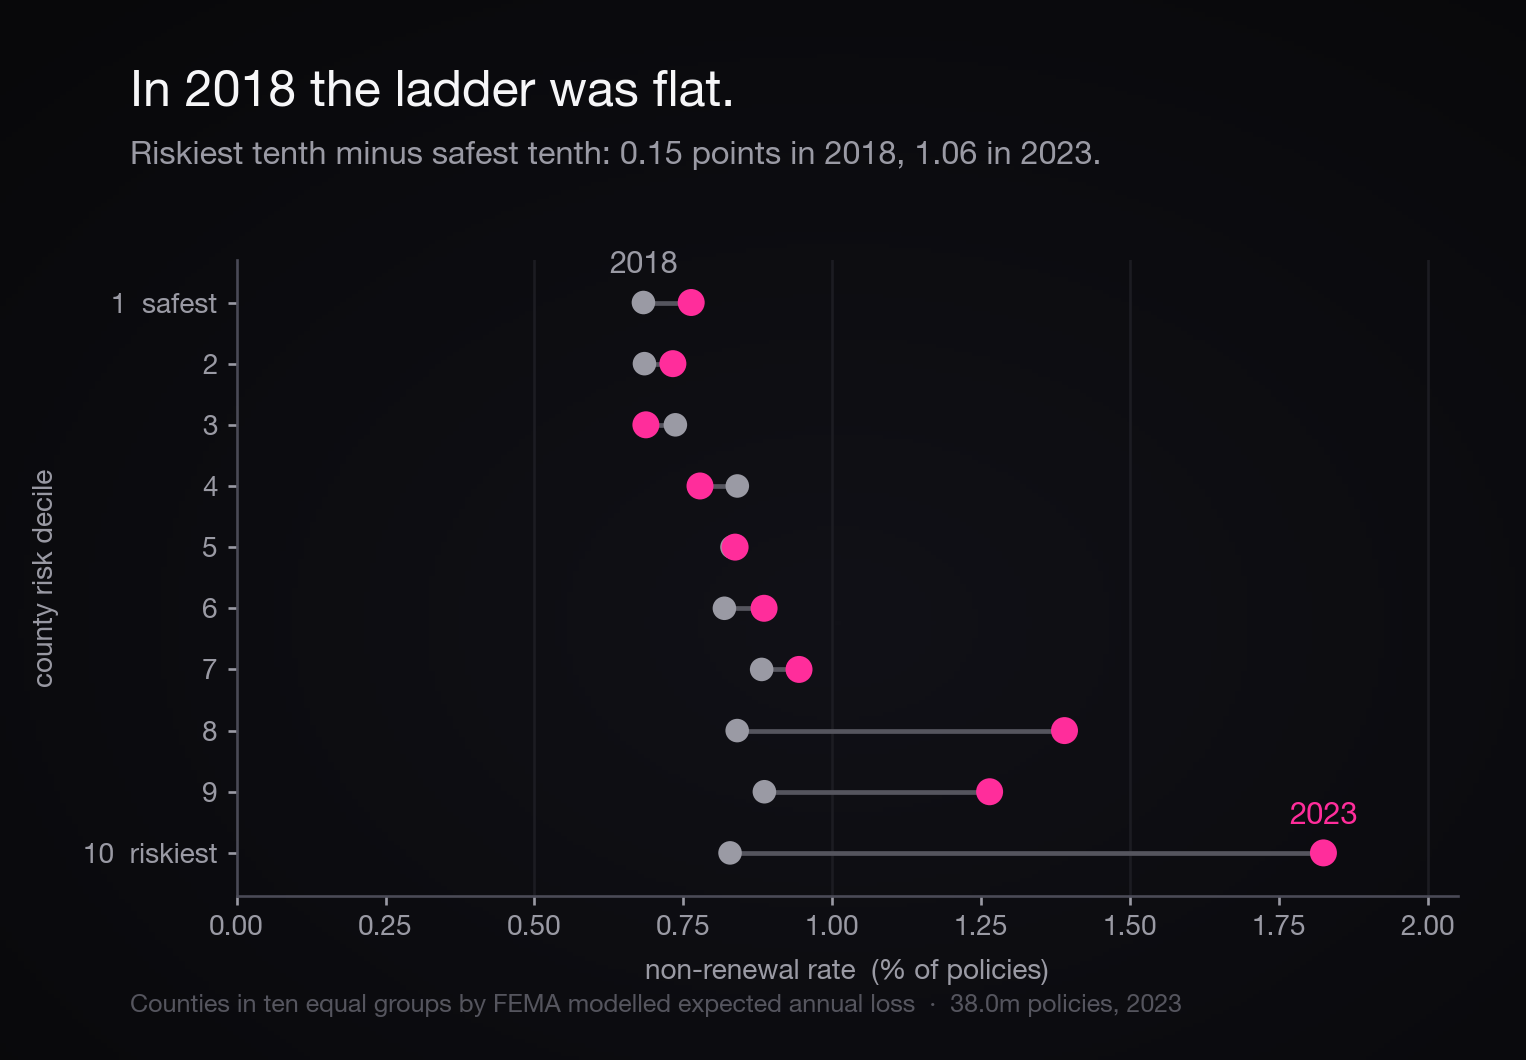
The risk didn't move. The pricing did.
You can date it
Because the risk scores are frozen, the year-by-year correlation is readable as a clean time series of insurer behaviour. It sits at nothing through 2018, drifts up through 2019 to 2021, and then jumps.
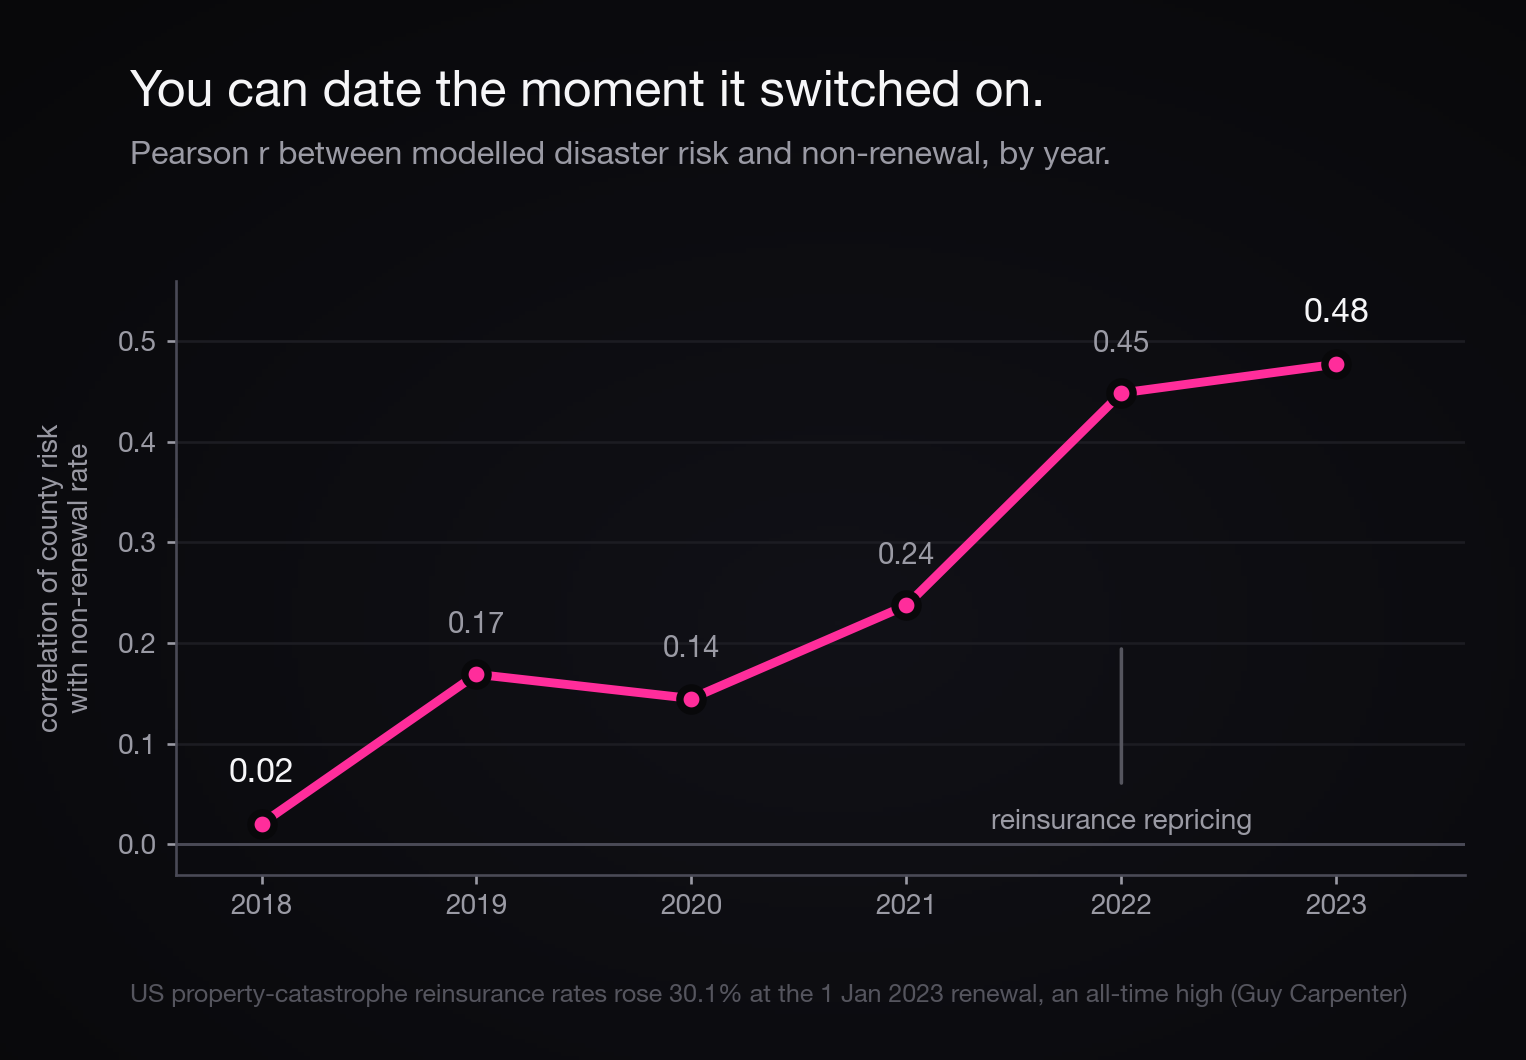
2022 is when the reinsurance market broke. Reinsurers are who your insurance company buys insurance from, and they had a catastrophic year: in September, Hurricane Ian produced somewhere between $50 and $65 billion of insured loss, the second-costliest storm ever recorded after Katrina.
At the 1 January 2023 renewal, US property-catastrophe reinsurance rates rose 30.1% in one sitting — an all-time high on the Guy Carpenter index, which starts in 1990. Howden put global property-catastrophe up 37%, the largest 1 January increase since 1992, and called it the hardest market in a generation.
Worth being precise about the order of events, because it is easy to overstate: the correlation moves in 2022, and the famous repricing landed at the January 2023 renewal. Property-cat rates had been hardening through 2022 already; Ian and the 1/1/23 renewal are the visible peak of a turn that started earlier, not the cause of the 2022 figure. What the data supports is that these are the same event, not that one produced the other.
The logic is straightforward either way. When the wholesale cost of catastrophe rises that fast and state regulators limit how quickly retail rates can follow, the remaining lever is choosing whose catastrophe to own.
It isn't the four states you're thinking of
The obvious objection is that this is Florida, Louisiana, California and Texas dragging a national statistic around. So take them out.
Outside those four states, in 2018, the riskiest tenth of American counties was non-renewed at 0.98× the rate of the safest tenth. Not 1.5×. Not 1.1×. Slightly less often than the safest places in the country. Risk was, to a first approximation, not a factor in the decision. By 2023 that ratio was 2.28×.
| Riskiest tenth ÷ safest tenth | 2018 | 2023 |
|---|---|---|
| All counties | 1.21× | 2.39× |
| Excluding FL, LA, CA, TX | 0.98× | 2.28× |
That second row is the smallest cell in the analysis — 54 counties and 974,627 policies in the top decile once four states are removed — so it belongs here as a robustness check and not as the headline. But it survives, and it points the same way.
They are not reacting to the disaster you had
If insurers were simply responding to events, past disasters should predict non-renewal better than a model does. They don't. Federally declared disasters explain 13% of the 2023 variation; the forward-looking risk model explains 23%.
The starkest version: 341 counties in this panel have not had a single federally declared disaster since 2018. They still account for 18.5% of 2023's non-renewals. Norfolk, Virginia roughly doubled. Taos, New Mexico doubled. Pitkin County, Colorado — Aspen — doubled, on zero declared disasters and an eighth-decile risk score.
| County | 2018 | 2023 | Declared disasters |
|---|---|---|---|
| Lake, CA | 1.24% | 7.56% | 8 |
| Barnstable, MA (Cape Cod) | 0.78% | 6.39% | 1 |
| Miami-Dade, FL | 1.60% | 4.29% | 2 |
| Taos, NM | 0.83% | 2.14% | 0 |
| Norfolk city, VA | 1.15% | 2.11% | 0 |
| Pitkin, CO (Aspen) | 0.80% | 1.84% | 0 |
The county that ruins it
Barnstable County, Massachusetts is Cape Cod, and it has the highest home-insurance non-renewal rate of any large county in America in 2023: 6.39%, comfortably ahead of Miami-Dade's 4.29%. In 2018 it was 0.78%, which is to say completely unremarkable.
Its FEMA risk score is mid-table. Fifth decile out of ten. On the model that produces every other number in this piece, nothing should be happening there at all.
I don't know why. Coastal wind exposure on a barrier peninsula, concentrated high-value property, a small number of carriers making a correlated exit — all plausible, none demonstrated by anything I have. It is the single loudest contradiction of my own finding, and it stays in the chart and in the table.
FEMA's risk index is built partly on historical loss records, so it is not fully independent of what insurers already knew. What keeps the trend interpretable is that the scores are frozen across the window: a constant cannot explain why its own correlation with non-renewal went from ~0 to 0.48. But it does mean the level of the correlation should be read loosely, and only the change read closely.
A non-renewal is an insurer's decision, not a household's outcome. It does not say whether anyone went uninsured. Most of these people found another policy. What they paid for it is the missing column, it is not in any public file, and it is almost certainly the more important story.
This is 23 insurers, about 65% of the market, and non-response is not random. And the reinsurance turn is offered as the mechanism because it matches the timing and is independently documented — not because this analysis identifies it. Correlation, dated precisely, is still correlation.
What it means for a house
For most of living memory, home insurance treated America as one country. Where you lived barely moved your odds of being dropped, and that was not because insurers were being generous. It was because the machinery for pricing geography — the catastrophe models, the reinsurance costs that make them bite — had not yet been pointed at the retail market with any force.
That is over. The sorting is not finished, it is four years old, and it runs on a model rather than on the last hurricane. Which means the counties that get repriced next are already identifiable, and they are not necessarily the ones that have been in the news.
Nobody sent a letter explaining that. The letters that did go out, 1.9 million of them, have a reason field that is not in any public dataset.
One row per county per year: policies, non-renewals, the rate, FEMA's modelled loss, the risk decile and the disaster count. The methodology ships with it, including the two county-name join traps that produced wrong numbers on my first run.
Sources: US Senate Budget Committee, county-level homeowners insurance non-renewal data, December 2024 · FEMA National Risk Index, county table · FEMA OpenFEMA disaster declarations, 2018–2023 · US Census 2020 county FIPS crosswalk · Hurricane Ian insured loss, Swiss Re Institute, December 2022 · Guy Carpenter US Property Catastrophe Rate-On-Line Index, January 2023 renewal · Howden, Past the Pricing Peak, January 2023. Every figure reproduced from the raw files by newsletter/data/issue-03/.