How to make wine look like medicine
For forty years the research said a drink or two a day lowers your risk of dying. The finding is real, it replicates, and a large part of it was manufactured by a decision nobody thought was interesting: who gets to count as a non-drinker.
Take a large group of adults, ask them how much they drink, wait a decade, and count who died. Do it in the United States, Denmark, Japan, anywhere. You get the same picture almost every time: the people who drink a little outlive the people who drink nothing.
That shape has a name, the J-curve, and it is one of the most reproduced findings in nutritional epidemiology. It survived into dietary guidelines. It is the reason your doctor shrugs at two glasses of wine and the reason “the French paradox” was ever a phrase.
The J-curve is not a fraud, and this is not an article about a study that got retracted. Every number in it is really there in the data. The interesting part is what the left-hand end of the curve is actually made of.
Non-drinkers are two different populations
When a survey sorts people into drinkers and non-drinkers, the non-drinker box fills up with two groups that have almost nothing in common.
The first is people who never drank. The second is people who stopped. And people mostly stop for a reason: a diagnosis, a bad liver panel, a medication that doesn't mix, a doctor saying something specific in a small room. Quitting is often a symptom.
Pool those two groups together and call the result “the baseline,” and the baseline is now pre-loaded with sick people. Every drinker in the study gets measured against it. They look terrific.
Epidemiologists have called this the sick quitter effect since 1988, when A. G. Shaper and colleagues published it in the Lancet under the flat title “Alcohol and mortality in British men: explaining the U-shaped curve.” They had 7,735 men and 504 deaths, and they noticed the abstainers were disproportionately men who had recently been told to stop. The objection is older than most of the studies that ignored it.
So I went and measured it
Rather than take that on authority, I rebuilt the curve from scratch on data where the two groups can be separated.
NHANES is the federal survey where they don't just ask you things, they weigh you and draw your blood. Crucially, its alcohol questionnaire asks two different questions: have you had 12 drinks in any one year, and have you had 12 drinks in your entire life. Those two answers are what let you tell a lifetime abstainer apart from a quitter. NCHS then links every respondent to the National Death Index.
Nine survey cycles, 1999 through 2016, followed to the end of 2019:
aged 20+
through 2019
of follow-up
the control group
Then I fitted the same Cox model twice. Same people. Same deaths. Same covariates. The only difference between the two runs is whether the 7,824 quitters are allowed to sit in the reference group.
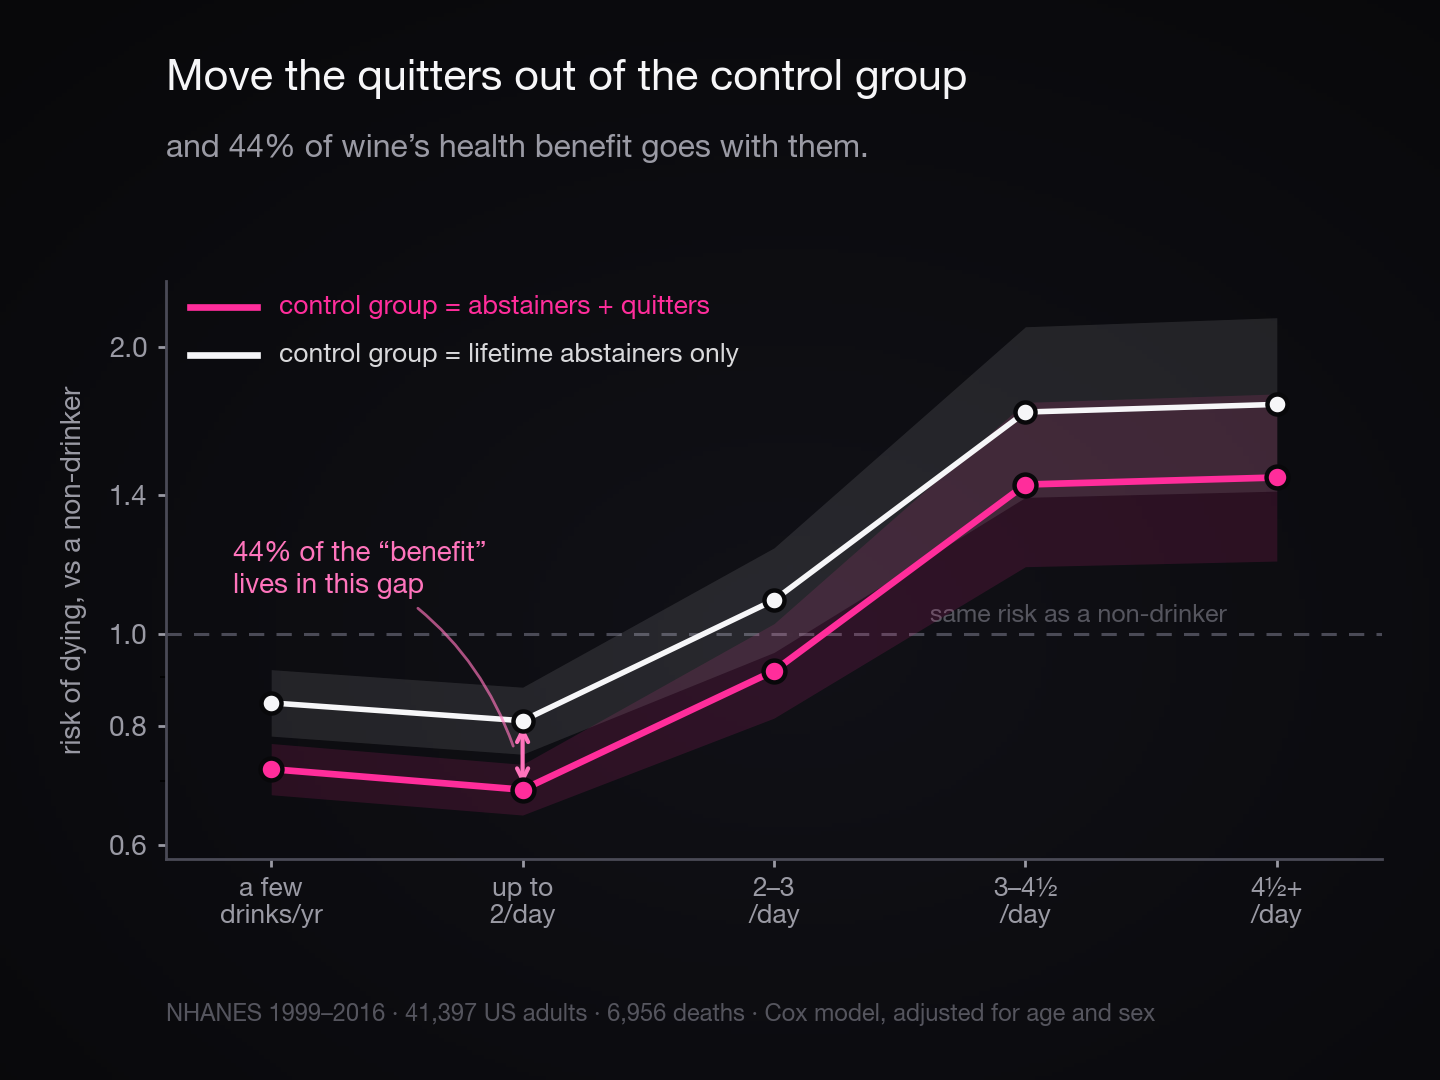
Pooled the classic way, light drinkers come out 31% less likely to die (HR 0.685, 95% CI 0.644–0.729). Split the quitters into their own group and change nothing else whatsoever, and it falls to 19% (HR 0.810, 0.747–0.878).
44% of the benefit was never about alcohol. It was about who was standing in the other column.
And the quitters are exactly as sick as the theory predicts. Their own death rate against lifetime abstainers is 27% higher (HR 1.271, 1.181–1.369), and the near-term picture is starker still:
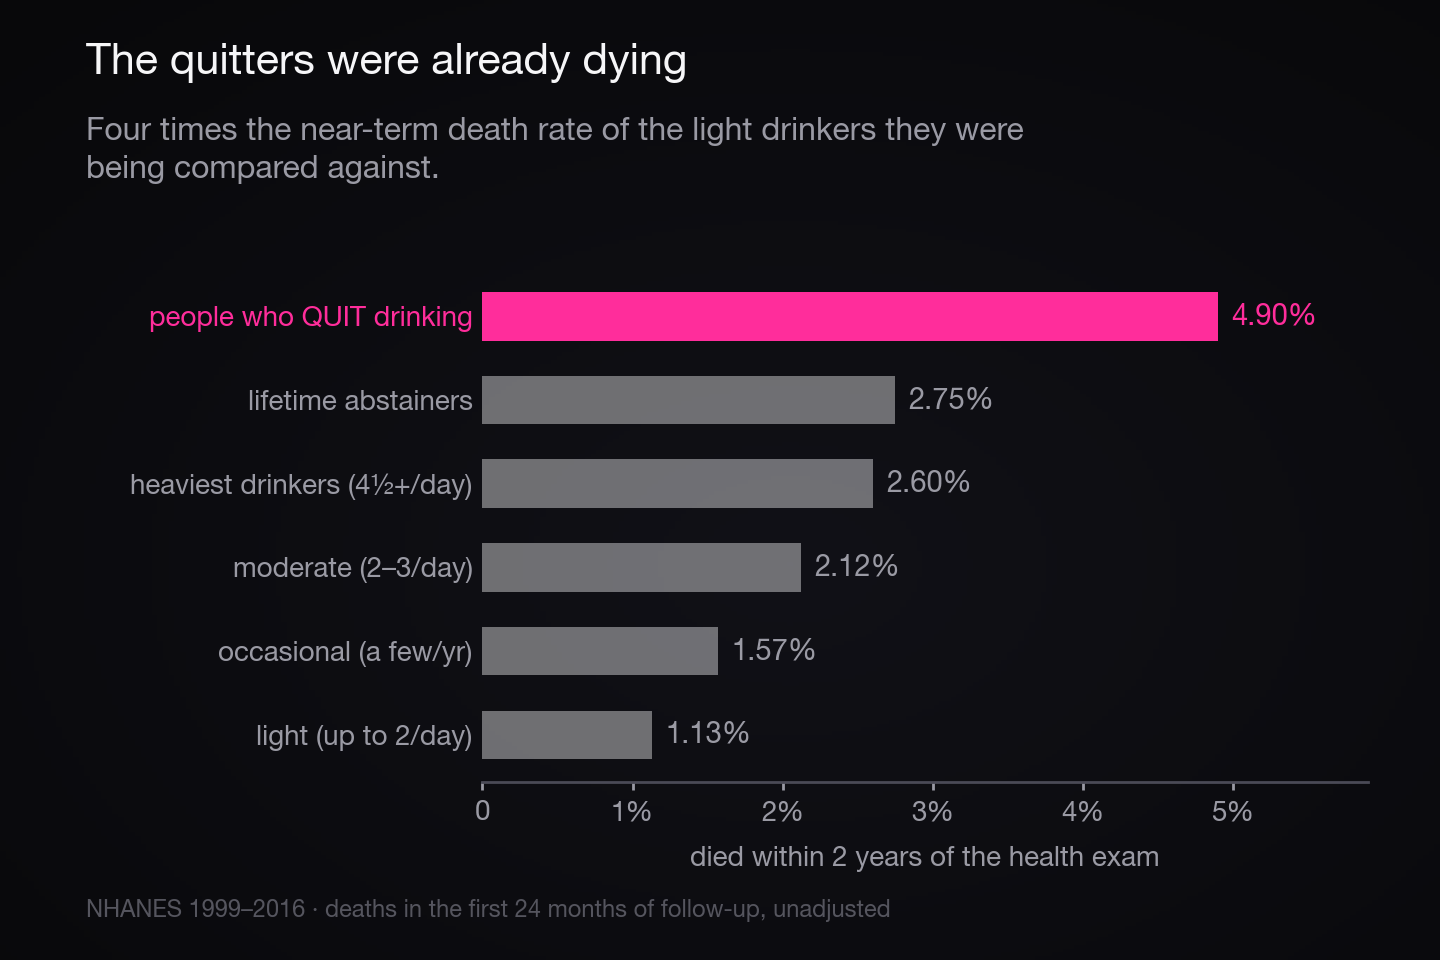
Nearly 5% of the quitters were dead within two years of walking into the exam trailer, against 1.13% of the light drinkers they were being compared against. Put that group on the left edge of your chart and you can make almost anything look protective.
The part I couldn't finish
Here is where an honest version of this article stops agreeing with the headline.
The remaining 56% will not die. I tried six ways.
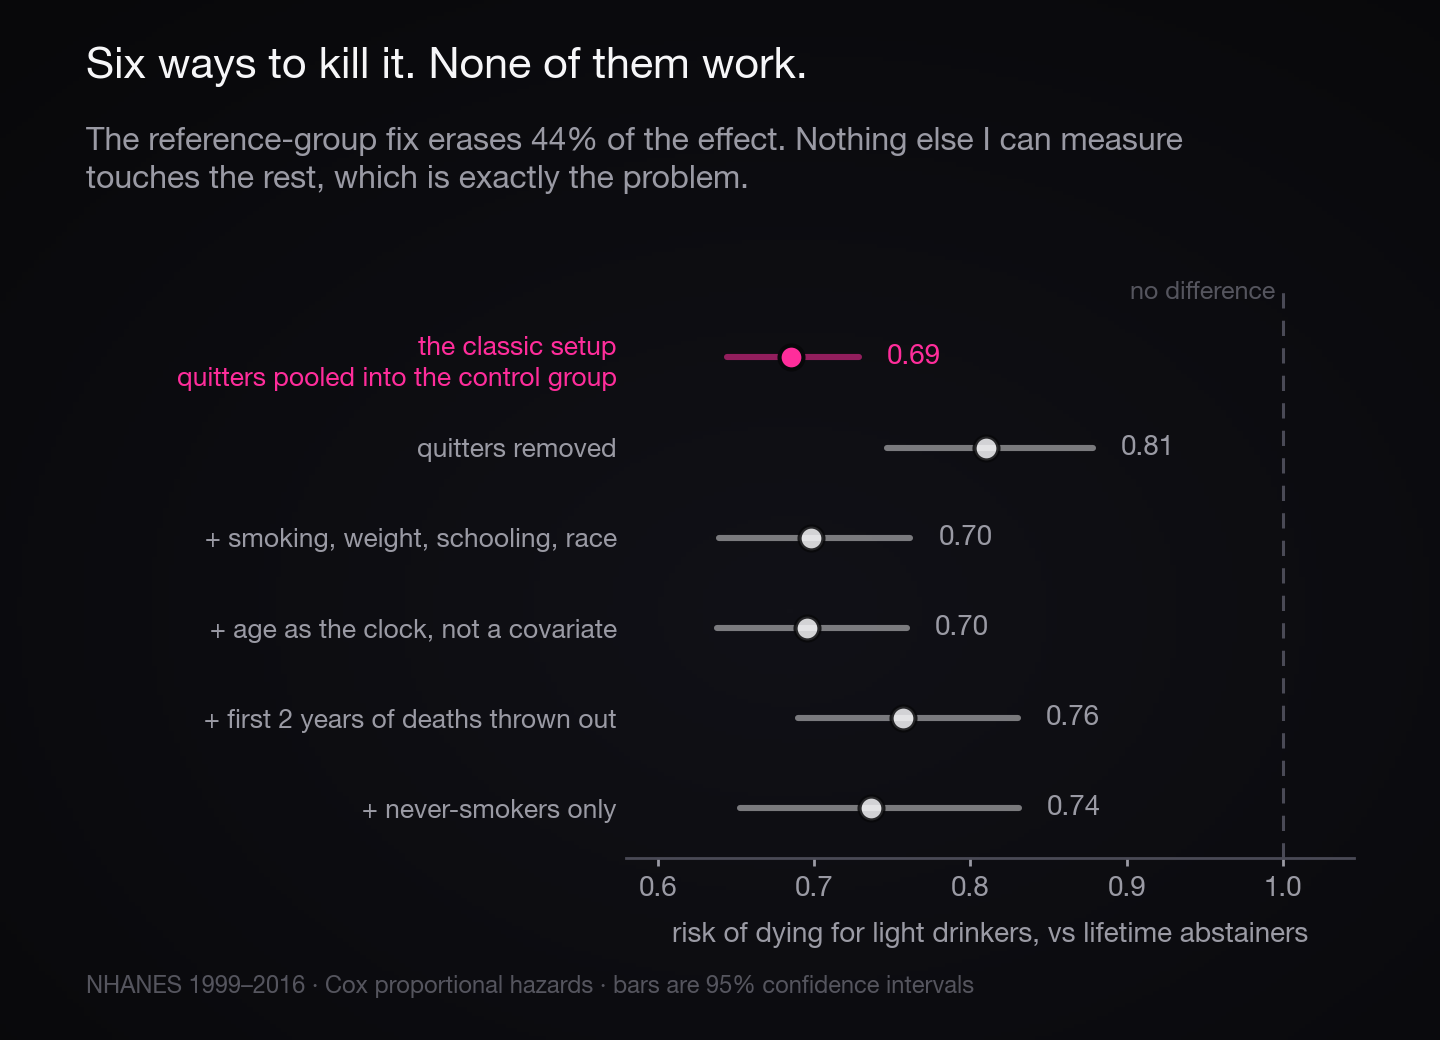
Adjust for smoking, measured BMI, education and race. Use age as the time scale instead of a covariate, so age is controlled non-parametrically rather than assumed linear. Throw out everyone who died within two years, which strips out reverse causation. Throw out every smoker who has ever existed and run it on never-smokers alone. Light drinkers still land between 0.70 and 0.76, and not one confidence interval touches 1.0.
This analysis does not demonstrate that alcohol is harmless, and it does not demonstrate that it's protective either. It isolates one specific artifact and measures it. The residual association is left standing, and I'd rather report that than pretend a regression settled it.
It's also an unweighted association analysis, not a nationally representative estimate — the NHANES survey weights ship in the CSV for anyone who wants to redo it properly — and it models all-cause mortality only.
That stubborn residual is either alcohol genuinely helping, or it is everything about a moderate drinker that a questionnaire cannot see. The income. The dinner table. The two glasses of wine with friends on a Tuesday being a symptom of a life that is going fine. No observational study can pull those apart, because you cannot randomly assign people to be the kind of person who has friends on a Tuesday.
The experiment nature already ran
So the field went somewhere confounding cannot follow.
Roughly a third of East Asians — about 540 million people — carry a variant of the ALDH2 gene that leaves them unable to clear acetaldehyde properly. Drinking makes them flush, sweat and feel ill. They drink far less, and not because of their income, their education, their marriage or their gym membership: the allele was dealt at conception, decades before any of those existed. Nothing downstream in a person's life can be hiding inside it.
That is a randomised trial, run by meiosis, for free. It's the logic behind Mendelian randomisation.
The China Kadoorie Biobank did it at scale: 512,715 adults enrolled, 161,498 genotyped for ALDH2-rs671 and ADH1B-rs1229984, followed about ten years. Genotype predicted a fifty-fold spread in how much the men drank, from roughly 4 grams a week to 256.
What those men said they drank produced the familiar friendly U-curve: the ones reporting one or two drinks a day had the lowest risk of stroke. What their genes made them drink produced a straight line up.
| Per 280 g/week of genotype-predicted intake | Relative risk | 95% CI |
|---|---|---|
| Intracerebral haemorrhage | 1.58 | 1.36–1.84 |
| Ischaemic stroke | 1.27 | 1.13–1.43 |
| Myocardial infarction | 0.96 | 0.78–1.18 (n.s.) |
No protective dip anywhere on it. The U-curve that self-report produced in the very same population simply is not there once the exposure is assigned by genetics instead of by life.
The same trick has been played before, on the same organ. Observationally, high HDL cholesterol tracks strongly with lower heart-attack risk — and alcohol genuinely does raise HDL, which was the mechanism everyone pointed at. Then Voight and colleagues ran the Mendelian randomisation in 2012 and found that genetic variants which raise HDL do not lower myocardial infarction risk at all. Two dead findings, sharing one corpse.
The thing worth taking away
The largest meta-analysis of this literature — Zhao, Stockwell and Naimi, 2023 — pooled 107 cohort studies, 4,838,825 participants and 425,564 deaths. Taken raw, low volume drinking shows a relative risk of 0.85. Adjust for the study-design characteristics that produce the artifact and it moves to 0.93 with a confidence interval crossing 1.0. Not significant. Meanwhile the high end never wavers: 1.19 at 45–64 g/day, 1.35 above that.
What I keep thinking about isn't the drinking. It's that this was in print in 1988, the fix is a single line of code, and it took a genetic natural experiment and thirty-five years to dislodge a result that a contaminated control group had propped up the whole time.
“Compared to what?” is not a pedantic question. It is usually the entire study.
All 41,397 adults, the drinking-status split that does the work, and the full method including the six models that failed.
Sources: CDC/NCHS NHANES 1999–2016 and the NCHS Public-Use Linked Mortality File (2019 release) · Shaper AG et al., Lancet 1988 · Zhao J, Stockwell T, Naimi T et al., JAMA Network Open 2023;6(3):e236185 · Millwood IY et al., Lancet 2019;393:1831–42 · Voight BF et al., Lancet 2012;380:572–80 · ALDH2 prevalence: Disease Models & Mechanisms 2022;15(6). Every figure reproduced from the raw files by newsletter/data/issue-02/.